
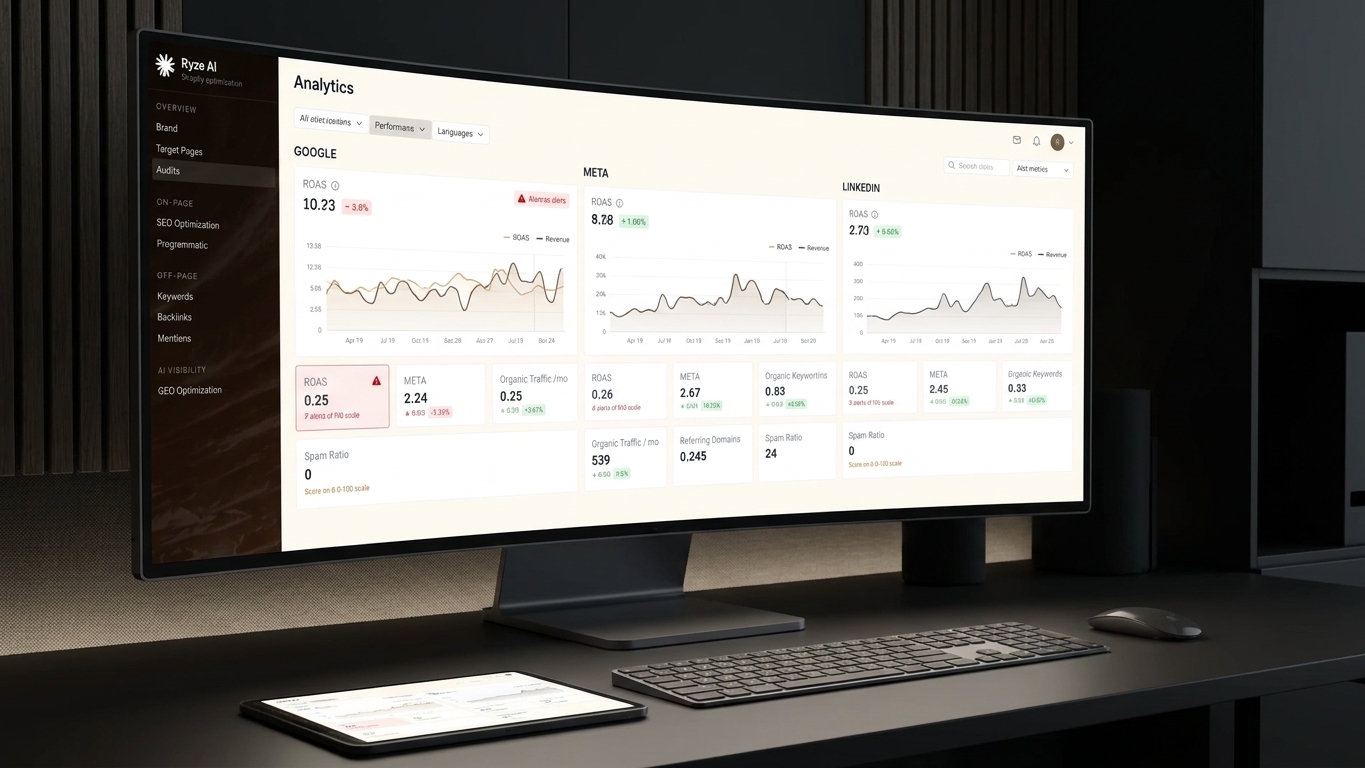
Every platform reports its own version of ROAS — and none of them agree with your bank account. This guide shows you how to build one blended ROAS number across Google Ads, Meta Ads Manager, and LinkedIn Campaign Manager so you can compare spend against actual revenue, not platform-reported guesses.
TL;DR
Measuring ROAS across Google, Meta, and LinkedIn in 2026 means pulling raw spend and conversion data from each platform's API or export, normalizing attribution windows (Google's 30-day default vs Meta's 7-day click/1-day view vs LinkedIn's 30-day post-click), and reconciling everything against your actual revenue source — Shopify, Stripe, or your CRM. Blended ROAS is the only number that matters for budget decisions. Platform-reported ROAS routinely overstates real return by 20-40% because each platform takes credit for the same conversion. Tools like Ryze AI automate this reconciliation instead of forcing you into a spreadsheet every Monday. Verdict: build the blended model first, automate it second.
Why this matters
Google Ads will tell you your Search campaign returned $6.20 for every dollar spent. Meta will tell you its Advantage+ campaign returned $5.80. LinkedIn will tell you its Sponsored Content hit $3.10. Add those up and you'd think you're printing money.
You're not. Each platform's pixel or conversion API claims credit for conversions that happened across multiple touchpoints. A single $200 purchase can get counted as a full conversion in Google, Meta, and LinkedIn simultaneously if all three touched the customer journey. Report that math to a founder and you'll blow next quarter's budget on a number that was never real.
Blended ROAS strips out the double-counting. It's the only version of the metric that survives contact with your P&L in 2026.

What you'll need
- Admin access to Google Ads, Meta Ads Manager, and LinkedIn Campaign Manager
- A source-of-truth revenue system: Shopify orders, Stripe payments, or CRM-closed deals
- A spreadsheet or BI tool (Google Sheets, Looker Studio, or similar) to hold the blended model
- UTM parameters consistently applied across all three platforms — no exceptions
- 60-90 minutes for the first build; 15 minutes per week to maintain it
Optionally, an AI-powered ad management platform like Ryze AI to pull cross-platform spend and conversion data automatically instead of exporting three separate CSVs every week
The steps
1. Pull raw spend from all three platforms
Start with spend, not conversions — spend is the one number every platform reports honestly. Export daily spend by campaign from Google Ads, Meta Ads Manager, and LinkedIn Campaign Manager for the same date range, minimum 30 days.
Use campaign-level exports, not account-level totals. You'll need the granularity later when you're deciding which campaigns to cut. Common mistake: pulling Meta spend at the ad set level but Google spend at the campaign level — mismatched granularity breaks your blended table before you've even started.
2. Normalize attribution windows
Google Ads defaults to a 30-day click / 1-day view attribution window. Meta defaults to 7-day click / 1-day view. LinkedIn defaults to 30-day post-click, 7-day post-view for Sponsored Content. These windows are not comparable out of the box.
Set all three platforms to the same window where the interface allows it — 7-day click is the safest common denominator for most e-commerce and B2B sales cycles in 2026. Where a platform won't let you change the window (LinkedIn's reporting UI is stricter than Meta's), flag the discrepancy in your model instead of ignoring it. Common mistake: comparing Google's 30-day number against Meta's 7-day number and concluding Google wins when the windows aren't equivalent.
3. Pull actual revenue from your source of truth
Go to Shopify, Stripe, or your CRM and export actual completed revenue for the same date range. This is your reality check. Match order timestamps to campaign click timestamps using your UTM parameters — utm_source, utm_medium, and utm_campaign need to be present on every single ad across all three platforms.
Expected outcome: you'll find revenue that no platform claimed (organic assist, direct traffic that started with an ad click) and revenue that multiple platforms claimed simultaneously. Both are normal. Common mistake: skipping UTM tagging on LinkedIn because B2B doesn't need it — LinkedIn's native attribution is the weakest of the three and needs UTM backup the most.
4. Build the blended ROAS formula
The formula is simple: total actual revenue attributed to paid channels divided by total spend across Google, Meta, and LinkedIn combined. Blended ROAS = (Shopify/Stripe/CRM revenue tagged with paid UTMs) / (Google spend + Meta spend + LinkedIn spend).
Do this at the weekly and monthly level, not daily — daily blended ROAS is too noisy to act on, especially for B2B accounts where LinkedIn's sales cycle can run 30-60 days from click to closed deal. Expected outcome: a single number, usually 15-40% lower than any individual platform's reported ROAS.
5. Segment blended ROAS by funnel stage
A single blended number hides which platform is doing the actual selling. Break the model into three views: top-of-funnel (impressions and clicks from cold audiences), mid-funnel (retargeting and warm audiences), and bottom-of-funnel (branded search, cart abandonment, direct response).
Google Search almost always wins bottom-of-funnel ROAS because it's capturing demand that already exists. Meta and LinkedIn typically win top-of-funnel reach but look weak on ROAS alone because they're creating demand, not capturing it. Common mistake: cutting Meta or LinkedIn budget because bottom-funnel ROAS looks bad, without checking whether that spend is feeding Google's branded search volume.
6. Reconcile platform-reported vs blended numbers weekly
Set a recurring 15-minute weekly check: pull each platform's self-reported ROAS next to your blended number. The gap between them is your attribution tax — the inflation caused by overlapping credit claims.
If the gap grows past 40% in any given week, something changed — a new pixel firing incorrectly, a UTM parameter dropped from an ad, or a platform update to its attribution model. Expected outcome: catching tracking breakage within a week instead of discovering it a quarter later when revenue doesn't match spend.
7. Automate the pull instead of repeating it manually
Manually exporting three platforms every week is the step most teams abandon by month two. An AI-powered ad management platform like Ryze AI connects to Google Ads, Meta, and LinkedIn simultaneously, pulls spend and conversion data on a schedule, and flags wasted spend and structural issues without a manual export cycle.
Expected outcome: the blended ROAS check becomes a five-minute glance instead of a spreadsheet rebuild. Common mistake: automating the pull but never automating the revenue-side match — the tracking half of the equation still needs a clean UTM and pixel setup underneath it.
Troubleshooting
- Blended ROAS is dramatically lower than any single platform's number. Check for duplicate UTM tagging — if two platforms are both tagging the same landing page click, you're double-counting spend against a single conversion.
- LinkedIn shows almost no conversions despite real pipeline. LinkedIn's native conversion tracking undercounts B2B sales cycles longer than 30 days. Cross-reference closed deals in your CRM against LinkedIn's original click date, not the report date.
- Meta's reported ROAS dropped sharply after an iOS update. Meta's Conversions API (CAPI) needs to be running server-side alongside the browser pixel — pixel-only tracking undercounts by 15-30% on iOS traffic in 2026.
- Google Ads and your Shopify revenue don't match even with matching UTMs. Check for currency mismatches or refunds — Google counts the original transaction value, Shopify nets out refunds, and the gap compounds over a 30-day window.
- Weekly blended ROAS swings wildly with no spend change. You're likely looking at daily noise instead of a rolling 7-day average — switch your model to a trailing average before drawing conclusions.
- You can't tell which platform is actually driving new customers vs repeat buyers. Segment your revenue export by new-vs-returning customer before matching it to ad spend; blended ROAS on new customer acquisition alone tells a very different story than blended ROAS across your full revenue base.
Tools and resources
- Google Ads, Meta Ads Manager, and LinkedIn Campaign Manager native reporting exports
- Shopify order exports or Stripe payment exports as your revenue source of truth
- A UTM builder or naming convention doc, shared across every team member touching ad accounts
- Ryze AI for automated cross-platform spend pulls, wasted-spend detection, and structure fixes without manual exports
- If your team is using Claude for reporting workflows, the Claude AI PPC management guide walks through building audit and reporting skills on top of your ad data
What to do next
Once blended ROAS is running weekly, the next move is fixing the structural waste it exposes — duplicate audiences across Meta and LinkedIn, overlapping keywords cannibalizing Google Search spend, or budget sitting in campaigns that never touch bottom-funnel revenue. That's a structure audit, not a measurement problem, and it's the natural next step after your blended number stabilizes in 2026.
FAQ
What's the best way to measure ROAS across Google, Meta, and LinkedIn? Build a blended ROAS model that pulls actual revenue from Shopify, Stripe, or your CRM and divides it by total spend across all three platforms — platform-reported ROAS alone overstates return because of overlapping attribution credit.
Is blended ROAS better than platform-reported ROAS? Yes, for budget decisions. Platform-reported ROAS is useful for in-platform bidding optimization, but blended ROAS is the only number that reflects actual revenue against actual spend.
How much does ROAS tracking software cost in 2026? Costs vary widely depending on whether you build a manual spreadsheet model (free but time-intensive) or use an automated platform — check current pricing directly on the tool's site since plans and tiers change.
How often should I check blended ROAS? Weekly at minimum, with a monthly rollup for trend analysis. Daily blended ROAS is too noisy to act on reliably.
Why does LinkedIn ROAS look so much lower than Google or Meta? LinkedIn's native attribution window doesn't account well for B2B sales cycles that run 30-60 days from click to closed deal — cross-reference your CRM's closed-deal data against LinkedIn's original click timestamps for a more accurate picture.
Can I automate blended ROAS tracking instead of doing it manually? Yes — an AI-powered ad management platform like Ryze AI connects to Google, Meta, and LinkedIn and pulls spend and conversion data on a schedule, cutting the manual export cycle most teams abandon by month two.
What attribution window should I use across all three platforms? 7-day click is the safest common denominator for most e-commerce and mid-length B2B sales cycles, though LinkedIn's reporting interface doesn't always allow window changes.
Does blended ROAS replace platform-level optimization? No. Use platform-reported ROAS to optimize bids and creative inside each channel, and use blended ROAS to make the actual budget-allocation call across channels.
One last thing
The biggest blended ROAS surprise most teams find in 2026 isn't a platform overstating results — it's discovering that 15-25% of tracked revenue has no clean UTM at all, sitting in a direct or organic bucket that started with a paid click nobody tagged correctly. Fix the tagging before you trust any blended number.